Issue
Netwitness New Health & Wellness Kibana dashboard shows empty as below.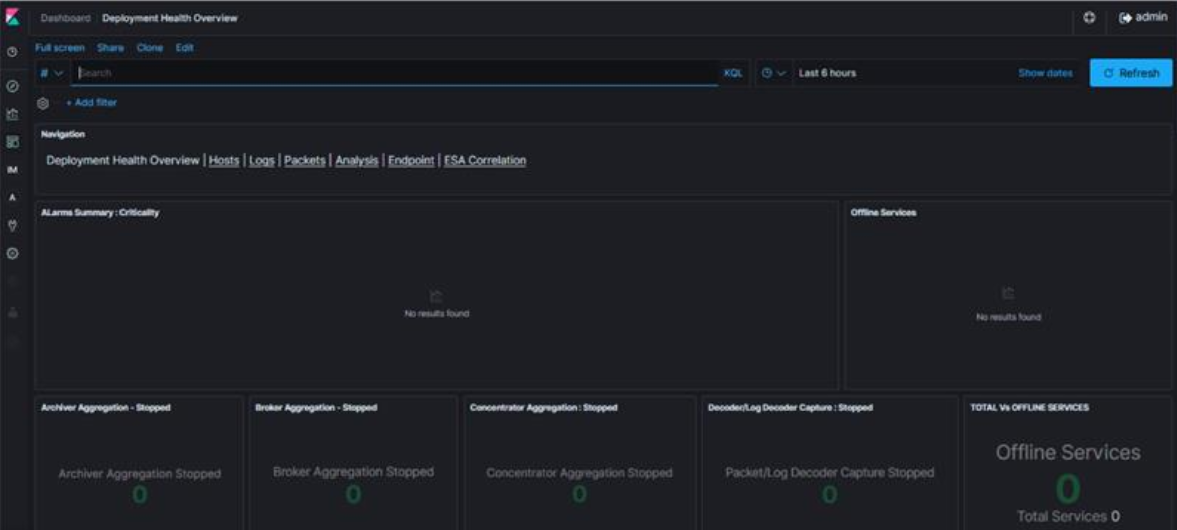
Cause
This issue is due to the stats collection being in a disabled state and that can be verified as below.1. SSH into the Admin Server.
2. Run nw-shell command to login with deploy_admin credentials.
# nw-shell
offline » login
user: deploy_admin
password: **********
offline » login
user: deploy_admin
password: **********
3. Connect to the Metric server using the below command
deploy_admin@offline »
connect --service metrics-server
4. cd into "/rsa/metrics/elastic/get-config"
>>
cd /rsa/metrics/elastic/get-config
5. Get the service id for core services from Netwitness UI
Go to (Admin) > Core service.
Click > View > Explore.
Expand the sys/stats node list.
In the UUID field, copy the value.
6. Display the Stats collection settings using the below command.
»
invoke
Example:
»
invoke a2534276-5b7f-4005-b0e4-96d53ba2f373
{
"service" : "log-decoder",
"serviceId" : "a2534276-5b7f-4005-b0e4-96d53ba2f373",
"enabled" : false,
"username" : "nwservice",
"password" : "b3a539cd43d9d9c22144674599fcb04e",
"port" : 9200,
"secure" : true,
"host" : "43378eb9-7ac0-4751-af6f-c2f46453985b",
"verifyHostname" : false,
"conversionUnit" : "SECONDS",
"interval" : "120 SECONDS",
"exclusion" : [
"/decoder/config/rules/**",
"/decoder/config/recovery/**",
"/decoder/parsers/feeds/**",
"/sys/config/scheduler/**",
"/sdk/stats/queries/**",
"/decoder/devices/**"
],
"inclusion" : [
"/decoder/**",
"/sdk/**",
"/database/**",
"/sys/**"
]
}
Resolution
Please follow the below steps to enable the stats collection settings.1. SSH into the Admin Server.
2. Run nw-shell command to login with deploy_admin credentials.
[root@AdminServer ~]#
nw-shell
offline »
login
user:
deploy_admin
password: **********
admin@offline »
connect --service metrics-server
admin@metrics-server:Folder:/rsa »
cd /rsa/metrics/elastic/enable-all
admin@metrics-server:Method:/rsa/metrics/elastic/enable-all »
invoke
Note: The API call might be time-consuming depending on the number of services configured in the environment.
4. Please verify the stats collection has been enabled.
deploy_admin@metrics-server:Method:/rsa/metrics/elastic/enable-all »
cd ..
deploy_admin@metrics-server:Component:/rsa/metrics/elastic » cd get-config
deploy_admin@metrics-server:Method:/rsa/metrics/elastic/get-config » invoke a2534276-5b7f-4005-b0e4-96d53ba2f373
deploy_admin@metrics-server:Component:/rsa/metrics/elastic » cd get-config
deploy_admin@metrics-server:Method:/rsa/metrics/elastic/get-config » invoke a2534276-5b7f-4005-b0e4-96d53ba2f373
{
"service" : "log-decoder",
"serviceId" : "a2534276-5b7f-4005-b0e4-96d53ba2f373",
"enabled" : true,
"username" : "nwservice",
"password" : "b3a539cd43d9d9c22144674599fcb04e",
"port" : 9200,
"secure" : true,
"host" : "43378eb9-7ac0-4751-af6f-c2f46453985b",
"verifyHostname" : false,
"conversionUnit" : "SECONDS",
"interval" : "120 SECONDS",
"exclusion" : [
"/decoder/config/rules/**",
"/decoder/config/recovery/**",
"/decoder/parsers/feeds/**",
"/sys/config/scheduler/**",
"/sdk/stats/queries/**",
"/decoder/devices/**"
],
"inclusion" : [
"/decoder/**",
"/sdk/**",
"/database/**",
"/sys/**"
]
}
5. The Kibana dashboard will now display the stats.
"service" : "log-decoder",
"serviceId" : "a2534276-5b7f-4005-b0e4-96d53ba2f373",
"enabled" : true,
"username" : "nwservice",
"password" : "b3a539cd43d9d9c22144674599fcb04e",
"port" : 9200,
"secure" : true,
"host" : "43378eb9-7ac0-4751-af6f-c2f46453985b",
"verifyHostname" : false,
"conversionUnit" : "SECONDS",
"interval" : "120 SECONDS",
"exclusion" : [
"/decoder/config/rules/**",
"/decoder/config/recovery/**",
"/decoder/parsers/feeds/**",
"/sys/config/scheduler/**",
"/sdk/stats/queries/**",
"/decoder/devices/**"
],
"inclusion" : [
"/decoder/**",
"/sdk/**",
"/database/**",
"/sys/**"
]
}
Product Details
RSA Product Set: RSA NetWitness PlatformRSA Product/Service Type: New Health and Wellness
RSA Version/Condition: 11.x,12.X
Platform: CentOS
O/S Version: 7
Summary
This document outlines the procedure to get the stats on kibana dashboard.
Approval Reviewer Queue
Technical approval queue